CS2 Team Performance Analysis: A Data-Driven Prediction Guide
How to analyse CS2 team performance data for match predictions — map win rates, pistol rounds, clutch rate, recent form, and how AI tools simplify it.

CS2 is the largest esports betting market by volume. More professional matches per week, more betting markets per match, and more data available than any other title in competitive gaming. That abundance of data is both the opportunity and the problem.
For a bettor who knows what to look for, CS2 is the most analytically tractable esports market available. For a bettor drowning in HLTV statistics without a framework, it's overwhelming. This guide gives you the framework — the specific performance metrics that actually predict CS2 match outcomes, how to read each one, and how to run the full analysis efficiently before every match.
Table of Contents
Why CS2 is uniquely suited to data-driven prediction
Map win rate and pool analysis
Pistol round performance
Clutch rate and pressure performance
Individual player rating trends
Recent form and tournament context
Roster stability and IGL dynamics
Putting it together: the CS2 pre-match framework
How Ensitics.io handles CS2 prediction
FAQ
Why CS2 is uniquely suited to data-driven prediction
Three things make CS2 more analytically predictable than most sports — and most other esports titles.
Every action is recorded. CS2 matches generate granular, structured data from the game server: every kill, every death, every round outcome, every bomb plant, every clutch attempt. Unlike physical sports where some events are judged subjectively or recorded inconsistently, CS2 data is complete and precise.
The format rewards consistency. A CS2 BO3 match is 2–3 maps, each map is often 20+ rounds, and each round follows identical rules. The length of the format means that genuine team quality asserts itself — a team that wins a map 16-5 is demonstrating structural dominance, not luck. This consistency makes historical data reliable as a predictor of future performance.
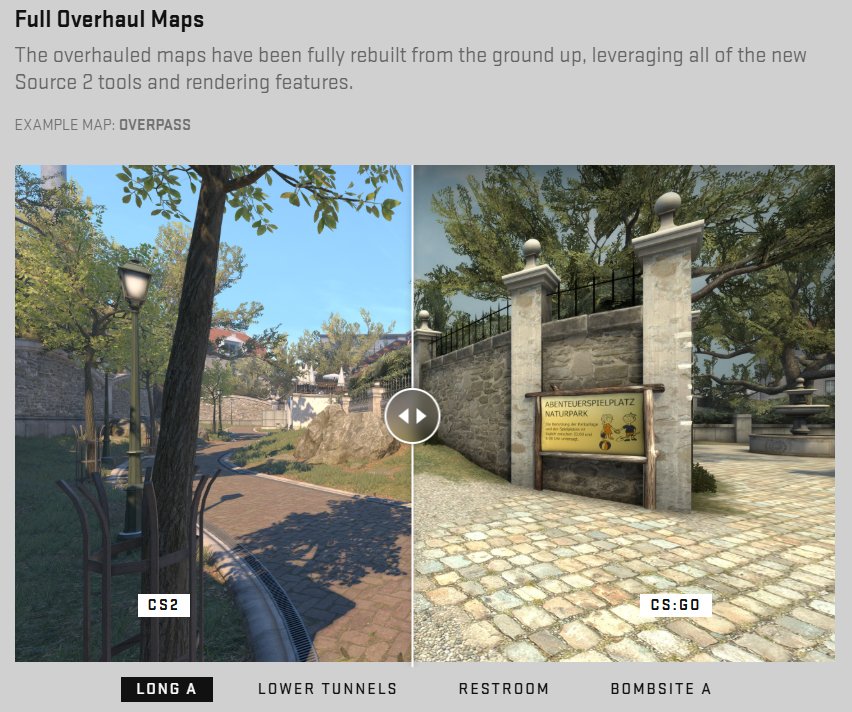
The map pool creates matchable patterns. CS2 uses a fixed map pool rotated periodically. Teams develop specific strengths and weaknesses on specific maps, and these preferences are consistent enough to model. The pick/ban phase before a match is itself a strategic contest, and understanding how two teams' map pools interact is often the highest-value analytical input.
Map win rate and pool analysis
Map pool analysis is the foundation of CS2 prediction. Before any other metric, you need to understand which maps each team is strong on, which they avoid, and what the likely series maps will be.
What to analyse:
Pick rate and win rate per map. A team's most-picked maps reveal where they have structural confidence. Their win rate on those maps reveals whether that confidence is justified. A team picking Mirage in 70% of their series and winning 78% of those maps is a different analytical picture from a team forced onto Mirage by opponent strategy and winning 45%.
Ban tendencies. Teams consistently ban their weakest maps. Identifying each team's first and second ban gives you a strong prediction of which maps will be available for the series. Once you know the likely available maps, you can assess each team's relative strength on that subset.
Modelling the likely series. With both teams' pick and ban tendencies, you can usually predict with reasonable accuracy which two or three maps a BO3 series will be played on before it starts. Then compare each team's win rates on those specific maps. If one team is 14-3 on Map A and the other is 6-9, that's a significant structural advantage on a likely map.
Map pool depth. In a long tournament with multiple BO3s, a team with a deep map pool — strong performance across 5–6 maps — has a structural advantage over a team with a narrow pool that opponents can exploit. Narrow pool teams are more predictable and more vulnerable to preparation-based counter-strategies.
Pistol round performance
Pistol rounds — the first round of each half — are disproportionately impactful on match outcomes. A pistol round win gives a team the resources to buy rifles in round 2, which frequently extends into a 3–5 round winning streak through the bonus economy system. Losing the pistol round forces a team into eco or force-buy situations for multiple rounds.
The numbers that matter:
Pistol round win rate by side (CT and T). Some teams are structurally stronger on pistol rounds than their general win rate implies. Teams with aggressive pistol round strategies, high individual aim performance in low-economy situations, or strong utility usage even with pistols punch above their weight in this phase.
Conversion rate after pistol round wins. Winning the pistol doesn't guarantee winning the subsequent rounds — but teams that convert pistol wins into 3+ round winning streaks are extracting maximum value. A team with a 65% pistol win rate that only converts into a 3-round run 50% of the time is less valuable than a 55% pistol win rate that converts 80% of the time.
Pistol performance in high-pressure situations. Some teams perform their pistol round strategy worse in high-stakes matches. Check whether pistol win rates hold up in playoff/elimination contexts vs. group stage matches.
Clutch rate and pressure performance
A clutch situation is any round where one player remains alive against multiple opponents. These situations are low-probability by nature — the expectation is that the outnumbered player loses — but some teams and players convert at significantly above-average rates.
Why clutch rate matters for prediction:
Clutch rate is a proxy for individual skill ceiling, composure under pressure, and game intelligence. A team with multiple high-clutch-rate players is harder to close out — they can steal rounds that should be losses and convert map-winning rounds from unlikely positions. Against such teams, statistical advantages matter less because the variance is higher.
How to use it: Check each team's overall clutch conversion rate and identify which specific players carry the clutch load. A team whose clutch performance is concentrated in one player is vulnerable if that player is having an off-game. A team with distributed clutch performers across multiple players is more resilient.
Also relevant: CT-side clutch rate specifically. The CT side is where teams need to convert clutches to hold map control — T-side clutches are higher impact when they occur, but CT-side clutch rate is a more consistent analytical input.

Individual player rating trends
CS2's individual performance is more quantifiable than most team sports. The HLTV rating system — now v2.0 — provides a single number that accounts for kills, deaths, assists, KAST (rounds with a kill, assist, survival, or trade), and impact rating.
What to look at beyond the headline rating:
Rating trend over the last 30–60 days vs. career average. Is a player performing above or below their historical baseline? A player rated 1.15 historically who's been at 0.98 for the last month is in a slump that may not be priced into betting markets yet.
Rating against top-20 opponents specifically. Some players perform well in general but decline significantly against top-level opposition. Rating filtered for tier-1 and tier-2 matches is more predictive for high-stakes matches than overall rating.
Entry fragger performance. The player opening duels on T-side (the entry fragger) has an outsized impact on round outcomes. High opening duel win rates — particularly on maps where T-side map control depends on early openings — are a high-signal individual metric.
The star player dependency check. Identify each team's highest-rated player and assess how dependent the team is on their performance. Teams where the second-highest rated player is rated 1.0+ are structurally more balanced than teams where the gap between the star and the next player is 0.15+. High star-dependency teams are more volatile — if the carry has a bad game, the team's structural weaknesses are exposed.

Recent form and tournament context
All of the metrics above are trailing indicators — they reflect past performance. Recent form is where you calibrate how much weight to give them.
The 30-day form window. Results in the last 4 weeks against comparable opposition are your primary input. Teams in genuine form win matches cleanly — high round differentials, consistent map control, no close calls against weaker teams. Teams in a slump often win on paper but struggle in rounds, show inconsistency across maps, or lose to opponents they should beat comfortably.
Tournament phase context. CS2 teams have demonstrably different performance profiles in different tournament phases. Some teams are known group stage specialists who underperform in playoffs. Others are explicitly reverse — slow starters who peak in elimination matches. These patterns are real and trackable. Before a high-stakes playoff match, check each team's historical record in playoff contexts specifically.
Travel and scheduling fatigue. LAN events with compressed schedules — multiple matches in two days — create fatigue that affects performance, particularly in day 3 and 4 of a tournament. A team playing their fifth map in three days is physically and mentally in a different state than one well-rested after a day off. Check the tournament bracket and schedule, not just the team matchup.
Roster stability and IGL dynamics
No analytical framework survives contact with an undisclosed roster change. This is the single most common source of unexpected losses for bettors who do thorough data analysis — they don't check the lineup before placing.
Always confirm the active roster. Before any bet, verify the five players who will actually play. Stand-ins, visa issues, and last-minute substitutions happen regularly in CS2 and can completely change the analytical picture.
IGL changes are the most disruptive. The in-game leader sets strategic structure, calls utility usage, and manages team decision-making in real time. A team that loses their IGL and replaces them — even with a technically skilled player — typically requires 4–8 weeks of adjustment before their tactical coherence returns to baseline. If a team recently changed IGL, downgrade your confidence in any prediction that relies on their structural quality.
New roster cohesion timeline. A roster addition who joined in the last 6 weeks is still building team chemistry and communication patterns. Their individual skill level is less relevant than the cohesion question — how well is the team operating as a unit? Round differentials and clutch patterns in post-addition matches tell you more than win/loss records.
Putting it together: the CS2 pre-match framework
Before every CS2 match you're considering betting on, run through these six questions:
Map pool: What are the likely maps based on pick/ban tendencies? Who is stronger on those specific maps?
Pistol rounds: Which team has the structural pistol round advantage, and how well do they convert wins into streaks?
Clutch rate: Does either team have a meaningful clutch rate advantage that increases variance?
Player ratings: Are both teams' key players in form? Any declining ratings that aren't priced in?
Recent form: Which team is actually performing better right now, independent of their rankings?
Roster confirmation: Is the expected lineup confirmed? Any stand-ins or recent IGL changes?
If you can answer all six clearly and one team comes out ahead on four or more dimensions, you have an informed basis for a pick. If the answers are split or unclear across multiple dimensions, the match has genuine uncertainty that should be reflected in your stake size.
How Ensitics.io handles CS2 prediction
Running the full six-question framework manually takes 30–45 minutes per match — feasible for one or two matches, impractical for a full weekly card.
Ensitics.io processes all of these inputs automatically for every CS2 match in its feed. The AI model — pulling live data directly from game servers — weights recent form, map pool dynamics, roster stability, player performance trends, and tournament context, then surfaces a direct output:
The pick — predicted winner
The algorithm — High Confidence for higher-certainty situations, Value Spotter for matches where bookmaker pricing may be off
Confidence level — Low, Medium, or High
Minimum odds — the threshold at which the bet makes analytical sense
CS2 typically dominates the Ensitics.io feed due to match volume — on any given weekday there are more CS2 professional matches than all other titles combined. The Value Spotter algorithm is particularly relevant for CS2 because roster instability and post-patch map pool changes are the two factors most consistently underpriced by bookmakers — and they're both in Ensitics.io's model.
Run your CS2 analysis in seconds — try Ensitics.io free → ensitics.io
FAQ
What stats matter most for CS2 betting? Map win rate on the likely series maps is the highest-impact single input. Recent form over the last 30 days against comparable opposition is the most important contextual factor. Roster confirmation — verifying the lineup before placing — is the most commonly skipped but frequently decisive check.
How important are pistol rounds in CS2 prediction? Very — pistol rounds have a disproportionate impact on map outcomes through the economy system. A team with a structural pistol round advantage on their picked maps can extend leads rapidly and make comebacks difficult. Pistol win rate + conversion rate into bonus rounds is a meaningful pre-match analytical input, not just a match-day stat.
How do I analyse CS2 map pools before a match? Check each team's map pick rate and win rate per map over the last 3 months. Identify their first and second bans. From those inputs, model which 2–3 maps the BO3 is likely to be played on, then compare each team's win rates on that specific subset. This gives you a more accurate picture than general win rate alone.
Does roster instability really affect CS2 performance? Yes — significantly and consistently. IGL changes are the most disruptive, typically requiring 4–8 weeks of adaptation. New player additions take 6+ weeks to develop full team chemistry. Bettors who don't check lineup news before placing are the most vulnerable to this factor because it's not visible in historical statistics.
What is the best CS2 match prediction tool? For raw statistics — HLTV is the comprehensive reference. For a pre-match prediction signal with confidence levels and minimum odds guidance that processes all relevant CS2 variables automatically — Ensitics.io is built specifically for the individual bettor workflow. Many serious CS2 bettors use both: HLTV for targeted deep dives, Ensitics.io for the pre-match signal.
→ Related: HLTV vs Ensitics.io: Which Is Better for Bettors? → Related: The 7 Esports Stats That Actually Predict Match Results → Related: How to Predict Esports Match Outcomes Using Data