The 7 Esports Stats That Actually Predict Match Results
Not all esports stats are worth tracking. These 7 are the ones that consistently predict match outcomes — with examples across CS2, Dota 2, LoL, and Valorant.

Open HLTV before any major CS2 match and you'll find hundreds of statistics. Player ratings, KAST (Kill-Assist-Survive-Trade) percentages, ADR (Average Damage per Round), opening kill ratios, clutch rates by map, rating against top-20 teams, rating in the last three months — the data goes deep.
The problem isn't a lack of stats. It's knowing which ones actually move the needle.
Most bettors track too many metrics and draw conclusions from the wrong ones. Some stats are descriptive — they tell you what happened. Others are predictive — they tell you what's likely to happen next. The two are not the same, and confusing them is one of the most consistent sources of bad betting decisions.
These are the 7 esports stats that are most reliably predictive across CS2, Dota 2, League of Legends, Valorant, and Overwatch — and how to read each one correctly.
Table of Contents
Recent win rate against comparable opposition
Head-to-head record — weighted for recency
Recent form index
Map win rate and pick/ban tendencies
Roster stability score
Patch delta — performance shift after updates
KDA and individual carry performance
How Ensitics.io processes all seven automatically
FAQ
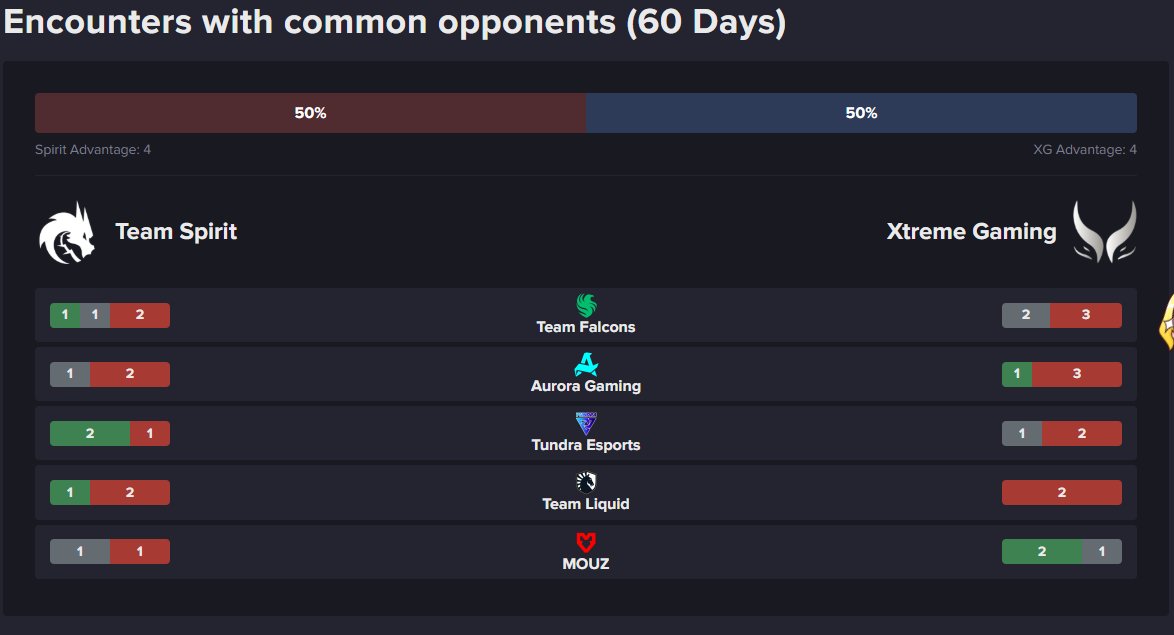
1. Recent win rate against comparable opposition
Why it matters: Win rate is the most cited stat in esports betting and the most frequently misread. Raw win rate includes wins against weaker opposition, which inflates a team's apparent strength. What actually predicts performance in a high-stakes match is win rate against teams of similar or higher calibre — filtered for recency.
How to read it: Filter by opponent rank (top 20, top 10, etc.) and by time window (last 60–90 days). A team with a 70% overall win rate but a 40% rate against top-10 opponents in the last two months is a very different bet than the headline number implies.
Cross-game note: In Dota 2 and LoL, also filter by tournament tier — regional league matches against weaker sides are less predictive than international LAN performance. The same team can look dominant domestically and fragile internationally.
Predictive strength: High — especially when filtered correctly. Unfiltered win rate is noise; filtered win rate is signal.
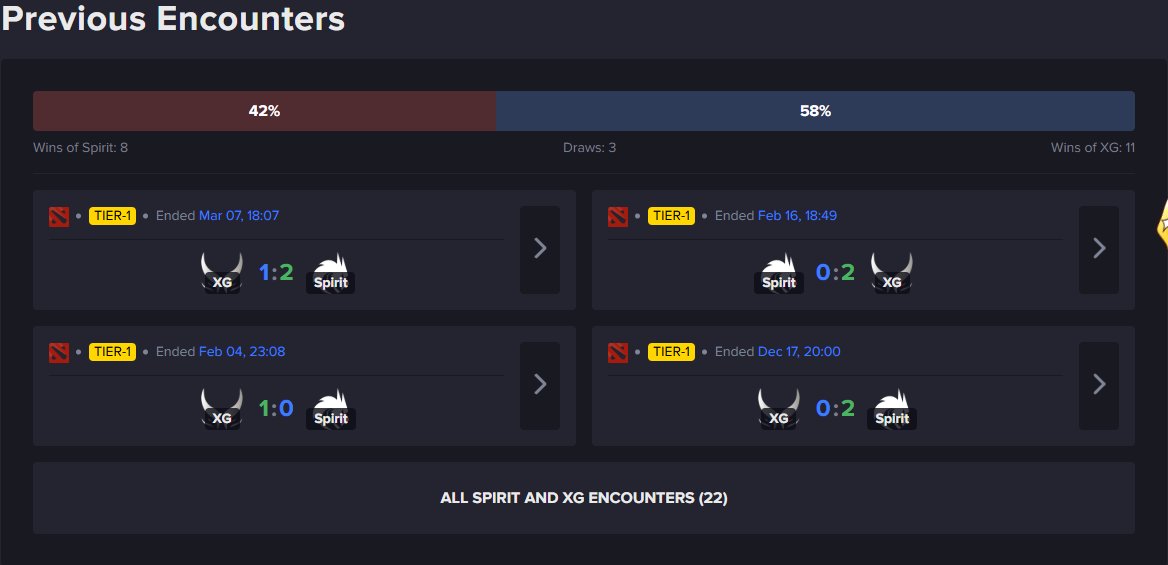
2. Head-to-head record — weighted for recency
Why it matters: Some matchups are chronically one-sided regardless of current rankings. Certain teams have playstyle advantages — or psychological edges — over specific opponents that persist across roster changes and meta shifts. H2H records capture these patterns in a way that general win rates don't.
How to read it: Weight recent matches more heavily than older ones. A 7-3 H2H record built over two years matters less than a 4-1 record in the last six months. Also filter by format — BO3 and BO5 H2H records are more predictive than BO1, because longer series reduce variance and better reflect true matchup quality.
Watch for: Roster changes that break the H2H pattern. If the team that historically dominated a matchup lost their IGL or star player, the pattern may no longer apply. Always check when the H2H matches were played relative to major roster moves.
Predictive strength: High — particularly in long formats and where both teams' rosters have been stable.
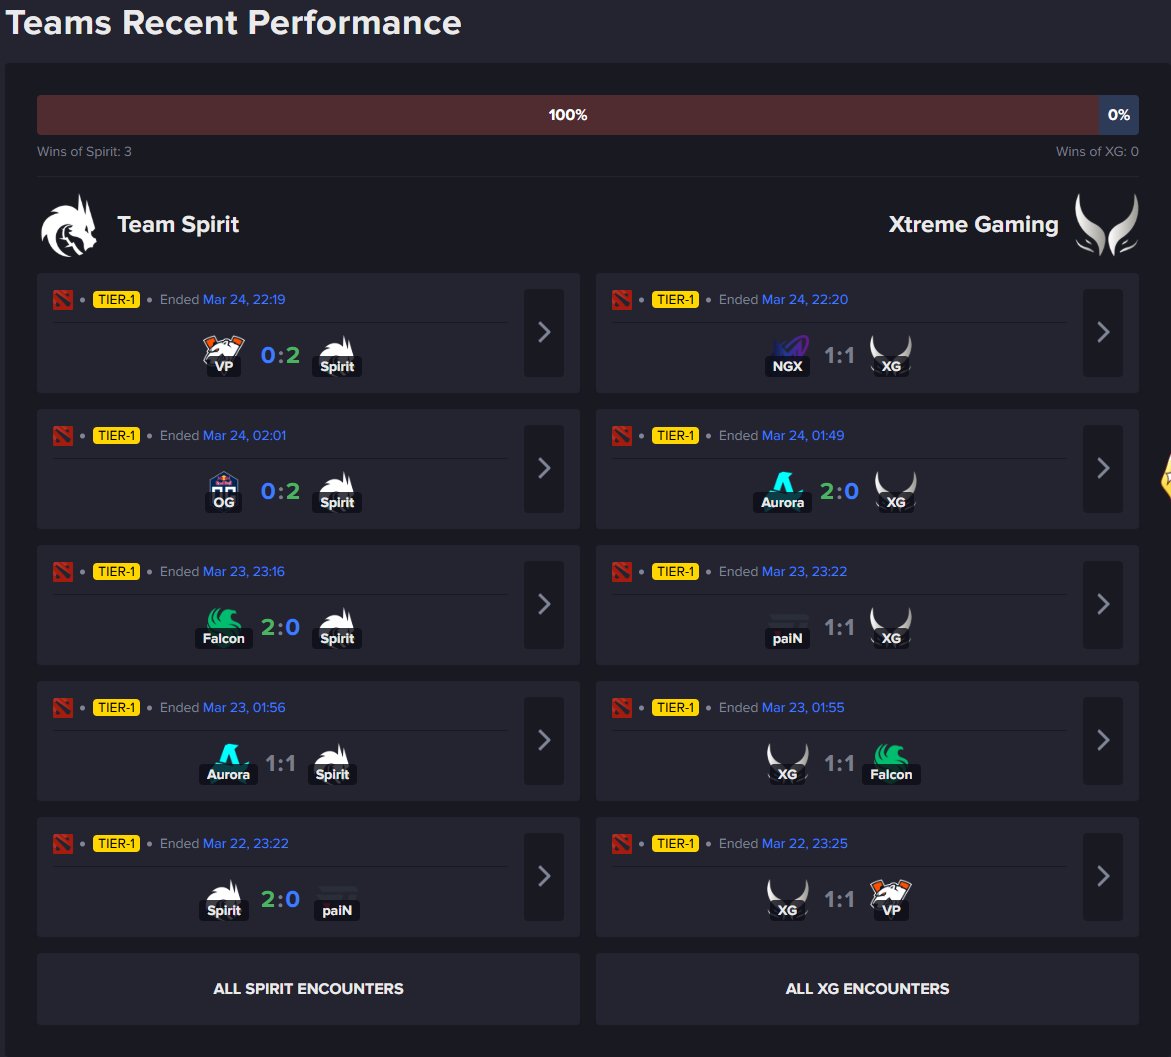
3. Recent form index
Why it matters: Teams go through genuine performance cycles that win rate doesn't capture quickly enough. A team that finished top-4 at a major may be mentally exhausted two weeks later. A team that just completed a bootcamp ahead of a tournament is often at peak performance. Recent form is the stat that tracks these cycles in real time.
How to read it: Look at the last 2–4 weeks of results — wins, losses, and the quality of both. A 5-0 run against weak opponents is less meaningful than a 3-2 run that includes wins over top-5 teams. Also look at the margin of results: close wins and heavy losses within the same period suggest inconsistency; clean wins across the board suggest genuine form.
Game-specific signals:
CS2: Round differentials per map tell you more than just win/loss — a team winning 16-14 repeatedly is shakier than one winning 16-8
Dota 2/LoL: Net game score in series (3-0 vs 3-2 wins) indicates dominance vs. variance
Valorant: Map scores and attack/defence-side splits reveal form more granularly than match outcomes alone
Predictive strength: Very high — recent form is one of the two most predictive single inputs for any upcoming match.
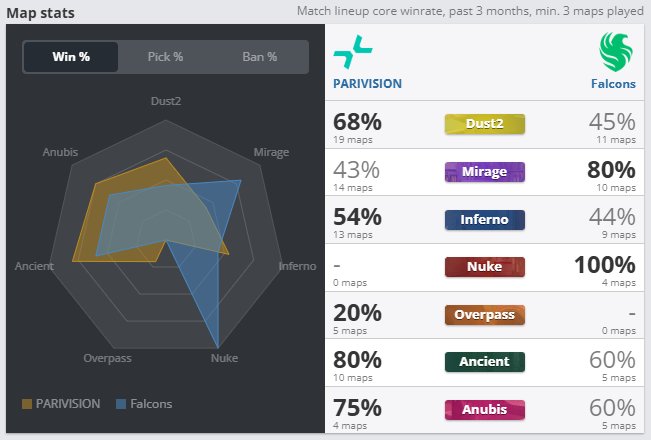
4. Map win rate and pick/ban tendencies
Why it matters: In CS2 and Valorant, the map pool is its own strategic layer. The pick/ban phase before a match is a contest in itself, and teams with a well-defined, exploitable map pool give their opponents a structural advantage before a single round is played. Understanding how two teams' pools interact is often more predictive than general win rates.
How to read it: For each team, identify their top 2 maps (consistently high win rate, frequently picked) and their weak maps (consistently low win rate, frequently banned). Then model the likely series: which maps will each team pick, which will they ban, and what does the remaining map look like?
Example: If Team A is 14-3 on Mirage and Team B always bans Mirage first, you lose that edge immediately. But if Team B's second ban is predictably Inferno, and Team A is also strong on Nuke, you can anticipate a Nuke map in the series and factor in Team A's 11-4 record there.
Valorant equivalent: Agent composition win rates by map tell a similar story — teams that have dominant compositions on specific maps and predictable bans create exploitable patterns.
Predictive strength: High — especially in BO3 formats where map selection is a full strategic phase.
5. Roster stability score
Why it matters: Esports teams are uniquely volatile compared to traditional sports. Roster changes — player swaps, stand-ins, role shifts, IGL changes — happen frequently and can dramatically alter team performance in ways that aren't immediately visible in win rates. A team that looks strong on paper may be mid-chemistry-rebuild.
How to read it: Check when the current roster was assembled. A core that's been together for 6+ months is a different analytical proposition than one that had a key addition or departure in the last 4–6 weeks. Pay particular attention to:
IGL changes — losing or changing the in-game leader disrupts strategic structure, often for 4–8 weeks
Star player changes — particularly in carry-dependent games (Dota 2, LoL) where one player's form drives team performance
Stand-in situations — a team playing with a stand-in is structurally compromised regardless of the stand-in's individual skill level; communication and trust take time
Predictive strength: Very high when a change is recent — one of the most underweighted factors by casual bettors who don't follow team news closely.
6. Patch delta — performance shift after updates
Why it matters: This is the stat unique to esports that has no equivalent in traditional sports betting. Game patches change the rules of the game — balance changes, map rotations, meta shifts — and some teams adapt faster than others. In the 2–4 weeks following a major patch, historical win rates are less reliable than usual, and teams whose playstyle was buffed or nerfed by the patch can significantly over or underperform expectations.
How to read it:
CS2: Major map pool rotations affect teams built around removed maps immediately. After Mirage or Dust2 rotations, track how teams perform on the maps they're now forced to play more frequently.
Dota 2/LoL: Identify which heroes or champions the strong teams on each side rely on. If a core hero for a team's strategy was significantly nerfed, their approach needs to adapt — and adaptation takes time.
Valorant: Agent balance patches and map changes follow a similar pattern — teams whose compositions relied on recently nerfed agents show performance dips within 1–3 events.
The key signal: Look for matches played after the most recent patch and weight those results more heavily than pre-patch performance. A team that was 8-2 before a patch but 1-3 after it is in a different state than their headline numbers suggest.
Predictive strength: Very high in the 2–4 weeks following a major patch — and consistently underweighted by the broader betting market, which creates value opportunities.
7. KDA and individual carry performance
Why it matters: Esports teams are more dependent on individual standout performers than traditional team sports. In CS2, a single player carrying a 1.3+ rating can compensate for significant team-level weaknesses. In Dota 2 and LoL, a carry player in form is a structural advantage. Individual performance metrics are lagging indicators — they reflect what already happened — but consistent individual dominance over a 30–60 day window is predictive.
How to read it:
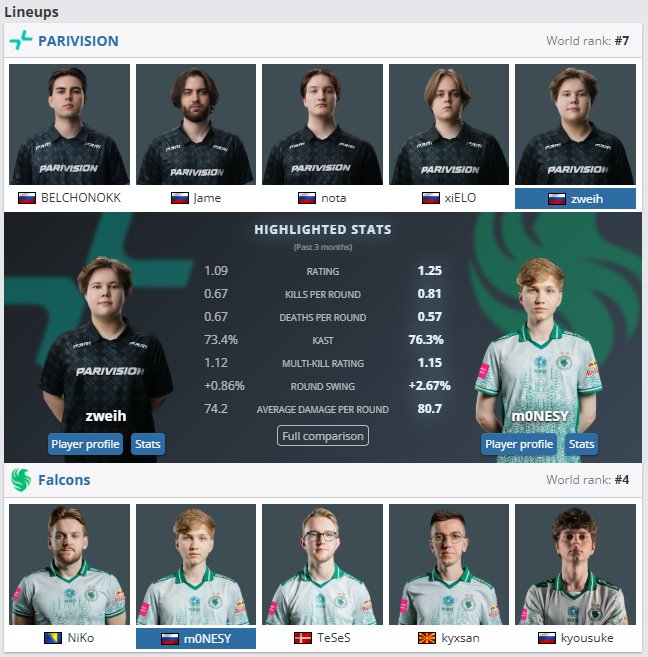
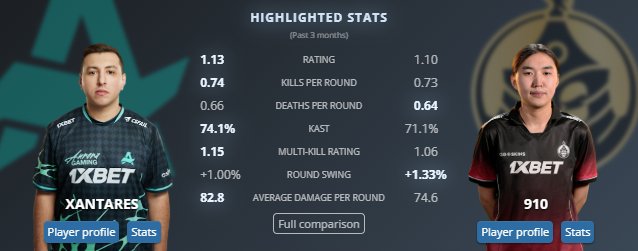
CS2 — HLTV rating: A team's star player rating over the last 3 months against top-20 opponents is one of the cleanest individual performance signals. Watch for declining ratings as a leading indicator of team form drops.
KDA in Dota 2/LoL/Valorant: Raw KDA is a weak signal because it varies by role. Better metric: KDA relative to their positional average. A carry player with a KDA well above average for their role is a meaningful signal; one at or below average despite their team's wins is a risk indicator.
Overwatch: Healing output, deaths per 10 minutes for support/tank roles, and final blows for DPS — role-specific metrics tell you more than aggregate KDA.
Watch for individual vs. team divergence: If a team is losing but their star player's individual stats are still strong, the team is likely in a tactical slump rather than an individual performance slump — and may recover faster. If the star's stats are also declining, the problem is deeper.
Predictive strength: Medium-High — strongest when looking at trend direction (improving vs. declining) rather than static values.
How Ensitics.io processes all seven automatically {#ensitics}
Running through all seven of these stats manually before every match takes 45–60 minutes — per match. Across a full card of CS2, Dota 2, LoL, Valorant, and Overwatch matches on any given day, that's a part-time job.
Ensitics.io processes all seven inputs — and more — automatically for every match in its feed. The output isn't a data dump; it's a direct signal: the predicted pick, a confidence level (Low, Medium, or High), and a minimum odds threshold that tells you when the bet makes analytical sense.
The Value Spotter algorithm is particularly relevant here. Patch delta and roster instability are two of the most consistently underweighted factors in bookmaker pricing — the market takes time to adjust to recent changes. Value Spotter looks for exactly these situations: matches where Ensitics.io's assessment of the likely outcome diverges from what bookmaker odds imply, which is where expected value bets are found.
You don't need to run the seven-stat framework manually before every match. But understanding what's behind the signal makes you a better analyst — and helps you know when to trust it and when to dig deeper.
See today's picks — try Ensitics.io free → ensitics.io
FAQ
What is the most important stat in esports betting? Recent form and roster stability are the two highest-signal inputs for most matches. Recent win rate against comparable opposition is the most reliable single number, provided it's filtered by opponent quality and time window. Raw, unfiltered win rate is one of the most commonly misread stats in esports betting.
Do the same stats apply across all esports games? The core framework — win rate, H2H, recent form, roster stability, patch context — applies across all titles. The game-specific metrics vary: map win rate is central to CS2 and Valorant, hero/champion performance is more relevant to Dota 2 and LoL, and role-specific metrics matter more in Overwatch. The underlying analytical approach is the same.
How much does a roster change affect a team's predictability? Significantly, particularly in the first 4–6 weeks after a major change. IGL changes are the most disruptive — the in-game leader sets strategic structure, and a new one takes time to establish their system. Star player changes in carry-heavy games (Dota 2, LoL) have immediate win rate impact. Always check roster news before placing on a team you haven't followed closely.
How do patches affect esports prediction? Major patches can shift team strength enough to invalidate recent historical data. In the 2–4 weeks following a significant patch, weight post-patch results more heavily than pre-patch ones, and identify which teams' playstyles were buffed or nerfed. This is one of the most consistent sources of value in esports betting because the broader market is slow to adjust.
What's the difference between descriptive and predictive stats? Descriptive stats tell you what happened — total kills, match results, past win rates. Predictive stats tell you what's likely to happen — recent form trends, patch-adjusted performance, carry player trajectory. The best betting decisions use descriptive stats as inputs to predictive assessments, not as conclusions in themselves.
→ Related: How to Predict Esports Match Outcomes Using Data — Complete Guide → Related: Best Esports Prediction Tools in 2026 — Ranked and Reviewed